Priced for Disappointment: South Africa’s Reform Paralysis Deepens
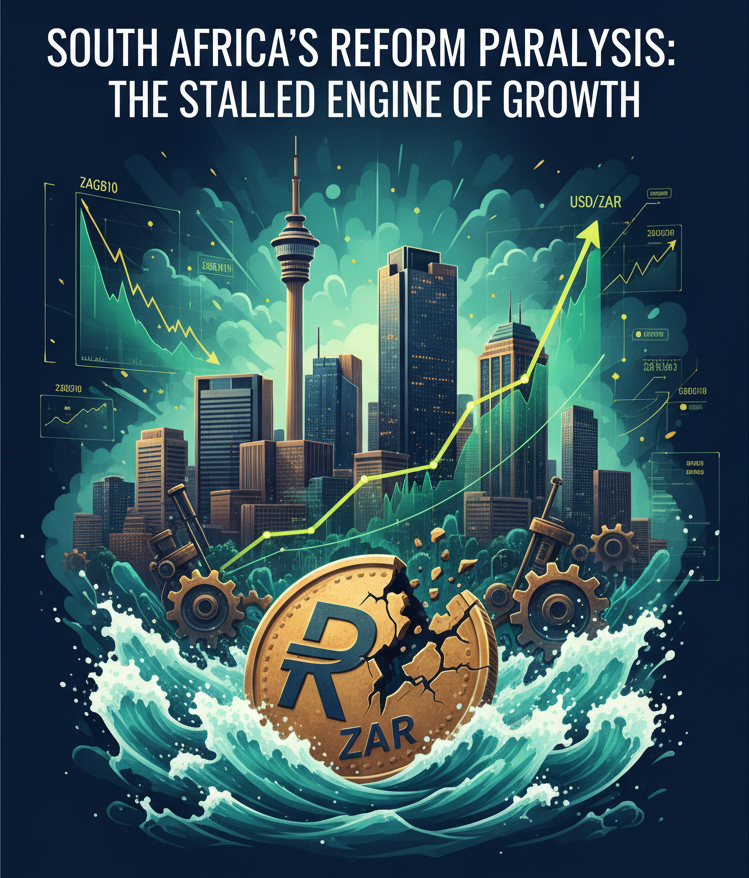
South Africa’s withdrawal of Credit Act amendments signals reform paralysis, not mere regulatory noise. With GDP growth near 1%, debt/GDP at 72%, and SAGBs yielding 11.5%, markets see a rentier equilibrium: bonds as carry trades, rand as volatility hedge, banks as stagnation proxies.

South Africa’s withdrawal of National Credit Act amendments may look like a small regulatory issue, but markets see it as a sign that reforms cannot survive political or populist pressure. In an economy already defined by low growth and high debt, the symbolism matters more than the law itself. Investors interpret the reversal not as a technical credit issue, but as confirmation that reform capacity is exhausted.
The draft amendments were modest, seeking to adapt household affordability tests to small and micro enterprises. With GDP growth averaging just ~1 percent over the past decade, unemployment above 32 percent, and fixed investment down to 15 percent of GDP—well below the 25–30 percent common among emerging markets—unlocking SME credit could have offered a small but useful growth lever. Their withdrawal signals that even low-hanging fruit is politically untenable.
The episode reflects South Africa’s structural trap. Potential growth has fallen from 3.5 percent in the 2000s to about 1 percent, driven by negative productivity, weak investment, and a savings rate of just 17 percent of GDP versus an emerging-market median of 33 percent. On the fiscal side, debt/GDP stands near 72 percent, deficits around 5.5 percent, and interest costs at 20 percent of government revenue. The gap between real yields on 10-year bonds (ZAGB10) at over 7 percent and real growth near 1 percent creates an r–g differential that makes debt unsustainable even with primary surpluses. Instead of advancing politically costly reforms, South Africa relies on high real yields to attract liquidity, settling into a rentier equilibrium where investors earn carry but the economy stagnates.
Macro-Fiscal Stress Matrix (Context vs EM Peers)
| Indicator | South Africa ZAF | Brazil BRA | Turkey TUR | Nigeria NGA | EM Median EM |
|---|---|---|---|---|---|
| GDP Growth 2025 (proj.) | ~1.0% | ~2.2% | ~3.0% | ~3.3% | ~3.5% |
| Debt / GDP | ~72% | ~76% | ~85% | ~38% | ~60% |
| Fiscal Deficit (% GDP) | ~5.5% | ~5.9% | ~6.5% | ~6.0% | ~4.0% |
| Interest / Revenue | ~20% | ~14% | ~16% | ~8% | ~10% |
| Gross Savings (% GDP) | ~17% | ~18% | ~27% | ~22% | ~33% |
Markets interpret these signals through reinforcing channels. Reform paralysis curbs growth, weaker growth erodes revenue, and higher borrowing widens sovereign spreads. That weakens the rand (USDZAR=X), importing inflation and forcing the SARB to keep the repo rate at 8.25 percent, further depressing growth. What looks like a small credit-law reversal thus feeds into a self-reinforcing loop, helping explain South Africa’s wide governance premium in EMs.
In fixed income, the picture is stark: 10-year SAGBs (ZAGB10) yield ~11.5 percent, about 450 bps over US Treasuries (US10Y), while 5-year CDS (SAFR5YUSDAM=R) trade near 280 bps—closer to Turkey (~300 bps) than Brazil (~190 bps), despite stronger fiscal institutions. In equities, banks that dominate the JSE—Absa (ABG.JO), FirstRand (FSR.JO), and Standard Bank (SBK.JO)—face capped loan growth and weak returns as SME-friendly reforms stall.
Investors once saw banks as proxies for domestic demand; today they represent stagnation. In FX, the rand remains a high-beta EM proxy, with 90-day realized volatility near 14 percent and implied closer to 16. Credibility shocks like this one spill directly into positioning. For ratings agencies, the withdrawal reinforces a narrative of weak reform momentum and fragile delivery, justifying South Africa’s placement just above junk.
Market Pricing vs Reform Delivery (Indicative, Sept ’25)
Notes: levels indicative; refresh with live Bloomberg/Refinitiv data at publication.
South AfricaZAGB10
BrazilBR10Y
TurkeyTR10Y
NigeriaNG10Y
South AfricaSAFR5YUSD
BrazilBR5YUSD
TurkeyTR5YUSD
NigeriaNG5YUSD
South AfricaCPI Adj.
BrazilCPI Adj.
TurkeyCPI Adj.
NigeriaCPI Adj.
South AfricaUSDZAR=X
BrazilUSDBRL=X
TurkeyUSDTRY=X
NigeriaUSDNGN=X
The peer comparison sharpens this perspective. Nigeria, despite inflation near 30 percent, pressed ahead with fuel subsidy removal in 2023, and markets rewarded the effort: CDS (NG5YUSDAM=R) compressed from above 1,200 basis points to around 700. Brazil, under fractious coalition politics, has nonetheless anchored fiscal rules, keeping CDS (BR5YUSDAM=R) near 190. Turkey (TR5YUSDAM=R) remains an outlier, with systemic reversals that keep CDS near 300 and the lira (USDTRY=X) treated as a political-risk instrument. South Africa lies in the middle: less chaotic than Turkey but unwilling to deliver reforms like Brazil or even Nigeria. That middle ground is not benign. It signals drift, a high-yield credit whose story is not convergence but yield extraction.
Looking ahead, markets frame this through probability-weighted scenarios. The base case, with 60 percent probability, is continued paralysis through the 2026 elections. In this world, the NCA amendments remain shelved, Eskom reforms move slowly, and Transnet bottlenecks persist. Yields remain between 11 and 12 percent, CDS stay near 280 to 300, and USD/ZAR trades between 18.5 and 19.5. The downside case, at 25 percent, is fiscal populism, with expanded transfers and stalled consolidation ahead of elections, triggering downgrade risk. In such a scenario, yields push above 12 percent, CDS widen to 350 or more, and the rand weakens beyond 20 to the dollar. The upside case, at just 15 percent, would require a reset: government reintroduces reforms with stronger communication, secures incremental progress in SME credit and infrastructure, and stabilizes the fiscal arithmetic. That could compress CDS toward 230 and modestly rerate banks such as ABG.JO, FSR.JO, and SBK.JO, though the growth ceiling would still remain under 2 percent.
Scenario Map (Probabilities & Asset Outcomes)
| Scenario | Probability | Policy Path | Asset Outcomes (indicative) |
|---|---|---|---|
| Base — Paralysis | 60% | Reforms shelved; slow energy/logistics progress; fiscal drift contained. |
SAGB 10Y (ZAGB10)11–12%
5Y CDS (SAFR5YUSDAM=R)280–300 bps
USD/ZAR (USDZAR=X)18.5–19.5
|
| Downside — Populism | 25% | Pre-election spending, stalled consolidation, downgrade risk rises. |
SAGB 10Y (ZAGB10)>12%
5Y CDS (SAFR5YUSDAM=R)>350 bps
USD/ZAR (USDZAR=X)>20.00
|
| Upside — Reform Reset | 15% | Reforms re-introduced with better comms; incremental SME/logistics wins. |
5Y CDS (SAFR5YUSDAM=R)~230 bps
SAGB 10Y (ZAGB10)~10.5%
SA Banks (ABG/FSR/SBK)Modest rerating
|
For global investors, the conclusion is direct. South African government bonds (ZAGB10) remain a carry trade, not a reform convergence story. Their yields are high, but they price disappointment, not upside. Bank equities (ABG.JO, FSR.JO, SBK.JO) are stagnation proxies, capped by structural constraints. The rand (USDZAR=X) is a governance hedge, traded for liquidity and volatility, not fundamentals. Ratings agencies sustain a negative bias, grounded in weak reform delivery rather than imminent crisis.
The Credit Act withdrawal is therefore not about student debt or affordability tests. It is about credibility. It confirms that South Africa has entered a rentier equilibrium, extracting yield from global liquidity in place of structural adjustment. Global investors no longer price in reform upside; they hedge against reform disappointment. This is why SAGBs remain wide, why the rand trades as a volatility proxy, and why equities resist rerating. Unless the political economy is rewired to insulate reform from populist reversal, South Africa’s debt arithmetic will move from fragile to unsustainable before the decade closes.